
“…thematic maps can be of different types, obtained in different ways. Most used are maps of soil fertility, crop productivity and vegetation indices.”
Lucas Rios do Amaral is an agronomist from the Federal University of São Carlos, master and doctor in phytotechnics from the “Luiz de Queiroz” Higher School of Agriculture (Esalq/USP).
Rios do Amaral is a specialist in precision agriculture and a professor at the Faculty of Agricultural Engineering at the State University of Campinas.

Rios do Amaral, specialist in precision agriculture and professor at State University of Campinas
Precision agriculture can be summarized as a management strategy that considers temporal and spatial variability to improve the sustainability of agricultural production. In other words, the farmer stops considering his area as uniform. The purpose is to carry out the correct management and the recommended dose for each part of the farm, which has the potential to improve profits and reduce environmental impacts.
For this type of management to be possible, it is important to know how the factors of production are distributed throughout the farm. Thus, obtaining thematic maps is essential. These maps can be of different types, obtained in different ways. Most used are maps of soil fertility, crop yield and vegetation indices.
Soil fertility maps are the most used in precision agriculture. Through soil samples collected in the field and use of this data to generate continuous fertility maps, it is possible to perform an analysis of soil properties and to recommend fertilizers in different doses throughout the farm.
Practically all companies that provide services in precision agriculture have in their portfolio the creation of soil fertility maps and fertilizer recommendation in different doses. Figure 1 illustrates this procedure.
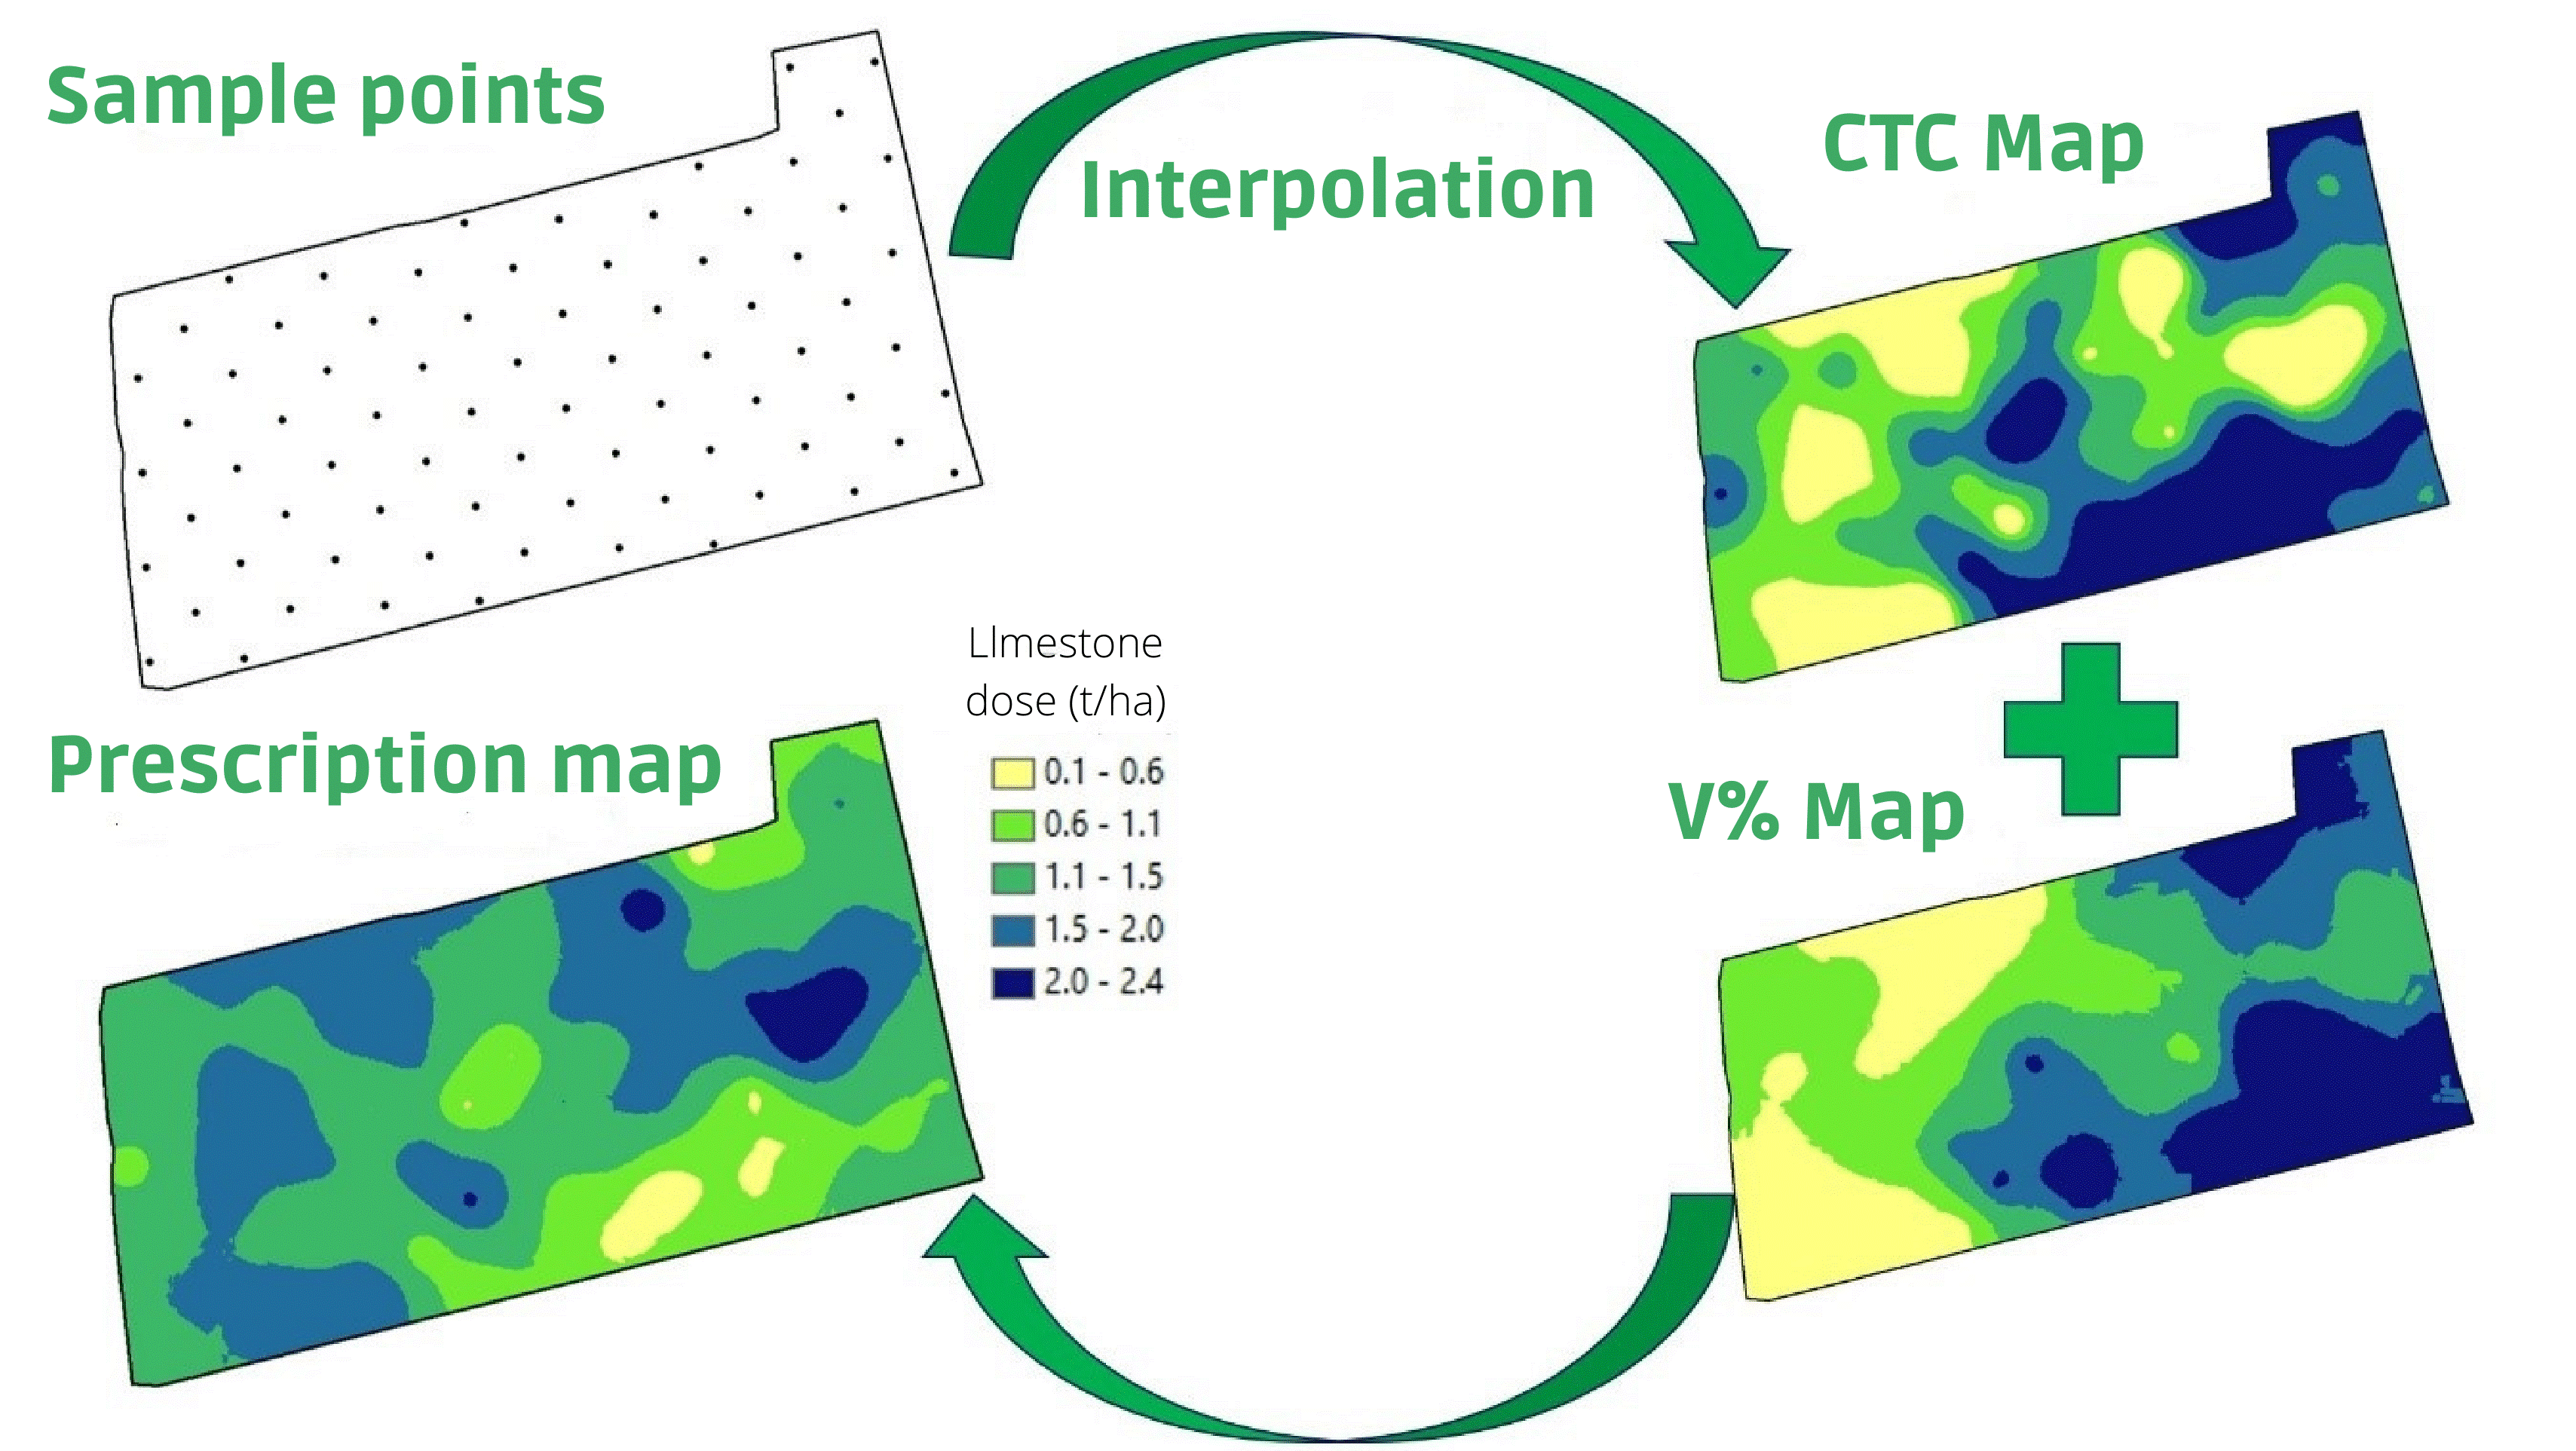
Figure 1 – Procedure for obtaining fertilizer prescription maps at different doses; example for liming.
Spatial interpretation of crop yields is interesting for understanding variations in profitability that exist across the farm and for understanding cause and effect relationships.
Investigating causes of low-yield areas is possible by exploring the relationships between other available maps and field assessments aimed at sites of interest.
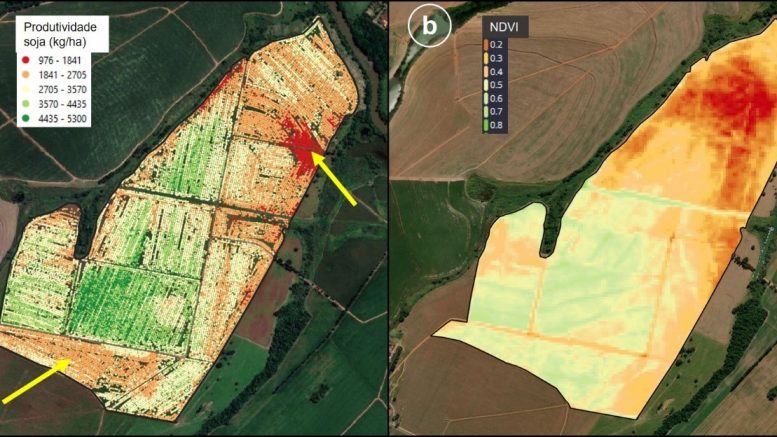
Productivity maps are obtained through sensors installed in harvesters and are essential for correct management decisions. Figure 2a shows a map of soybean yields and two regions that had a lower than expected behavior compared to neighbor areas, which should lead to investigations to understand their causes.
Another way of inferring about the development of a crop is through remote sensing: images collected by satellites, planes, drones or even cameras and sensors incorporated in agricultural machines.
It is common to generate vegetation indexes obtained through combinations of spectral bands available in the sensors/cameras. These indexes seek to highlight plant properties, such as plant vigor, soil cover, leaf area index, plant health, among other applications.
The best-known index is the NDVI (Normalized Difference Vegetation Index), which traditionally uses the red band, which is sensitive to chlorophyll variation in leaves, and the near-infrared band, influenced by the canopy structure of the crop (Figure 2b). However, there are several possibilities of vegetation indexes that can be explored.
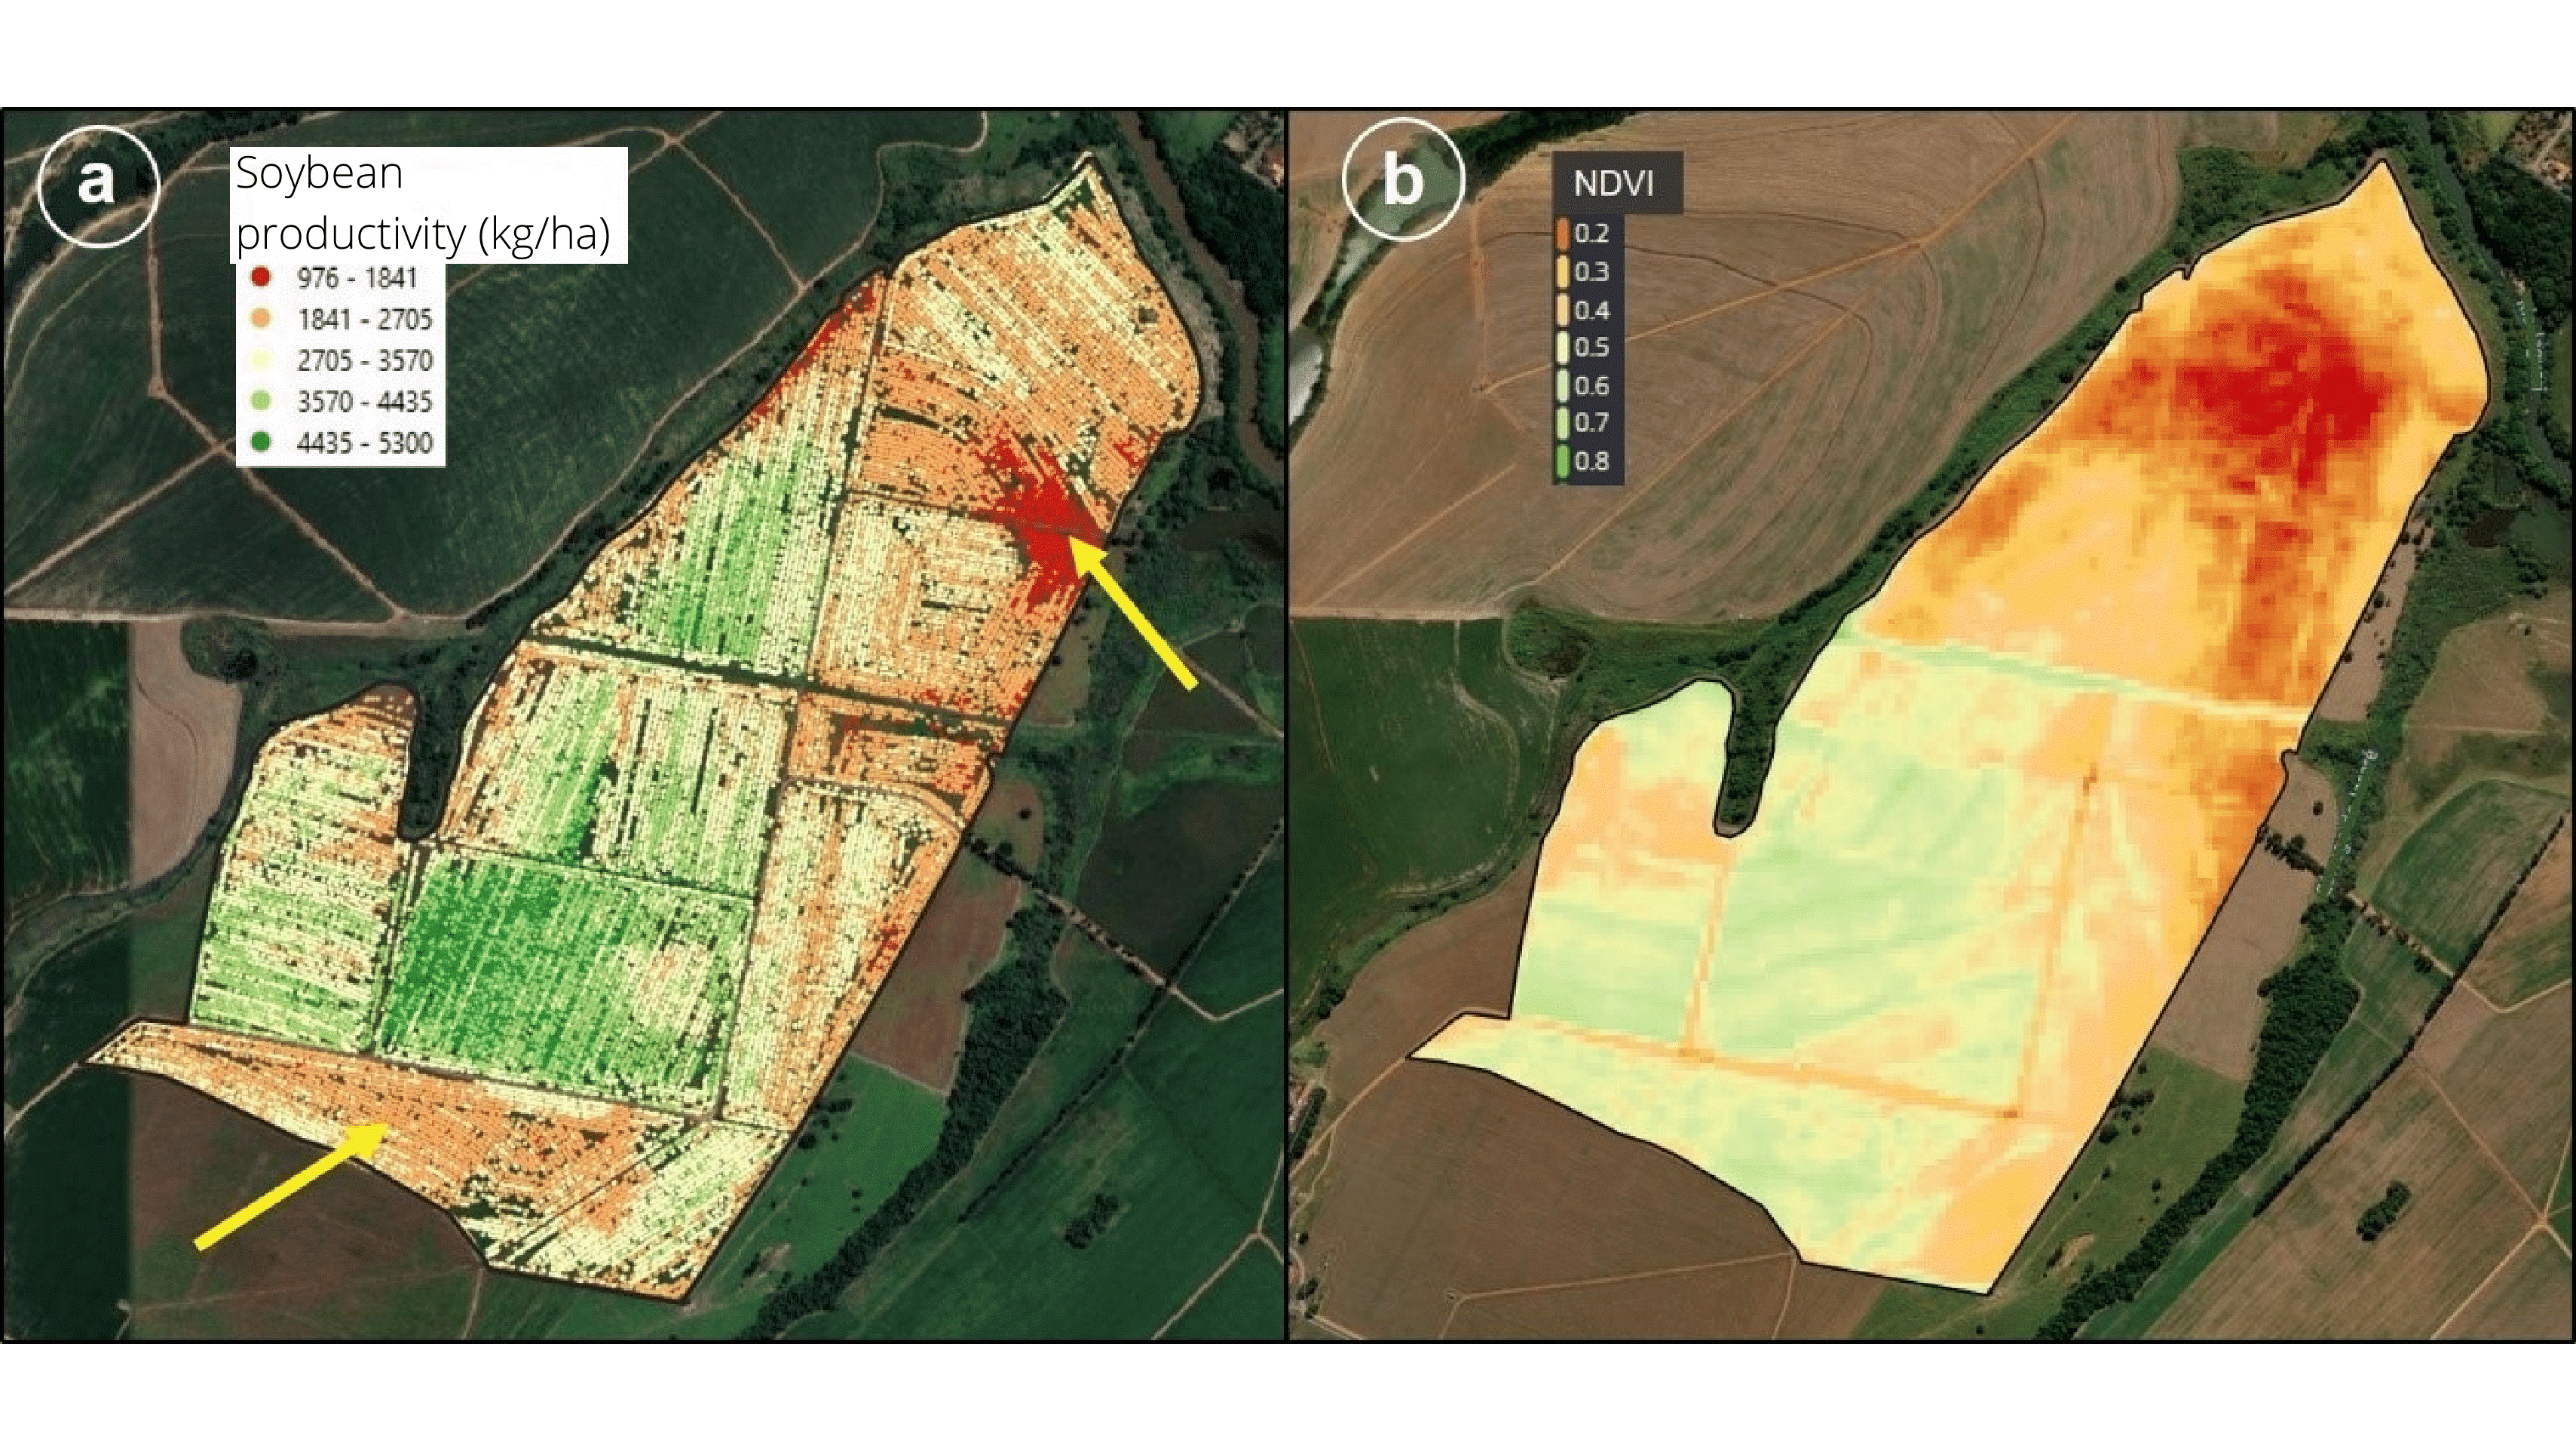
Figure 2 – On the left, map showing soybean yield data (a), indicating two regions with lower-than-expected yields (yellow arrows). Right, NDVI image of the initial stage of development of the same soybean crop.
There are also pedological, soil electrical conductivity and pest maps (insects, diseases and weeds). Soil maps (Figure 3) are traditional in agriculture for the knowledge of the types of soil present in the areas and can guide the interpretation of the productive potential of the area and the decision making.
Apparent electrical conductivity data of the soil are generally obtained by sensors pulled by agricultural machines, or even quadricycles, and indicate soil variation throughout the farm (Figure 3); several soil properties influence the sensor signal, but the preponderant factor is texture.
Pest maps are in high demand. Crop protection costs are a large part of production costs and technology for spraying at variable rates is already built into most modern sprayers. However, mapping biological agents is not simple and is quite risky in the event of a wrong diagnosis, especially if phytosanitary treatment is not done where it would be necessary.
With digital tools increasingly present in agriculture, several approaches have been proposed and validated, such as damage recognition from pest attacks through drone images and machine learning algorithms.
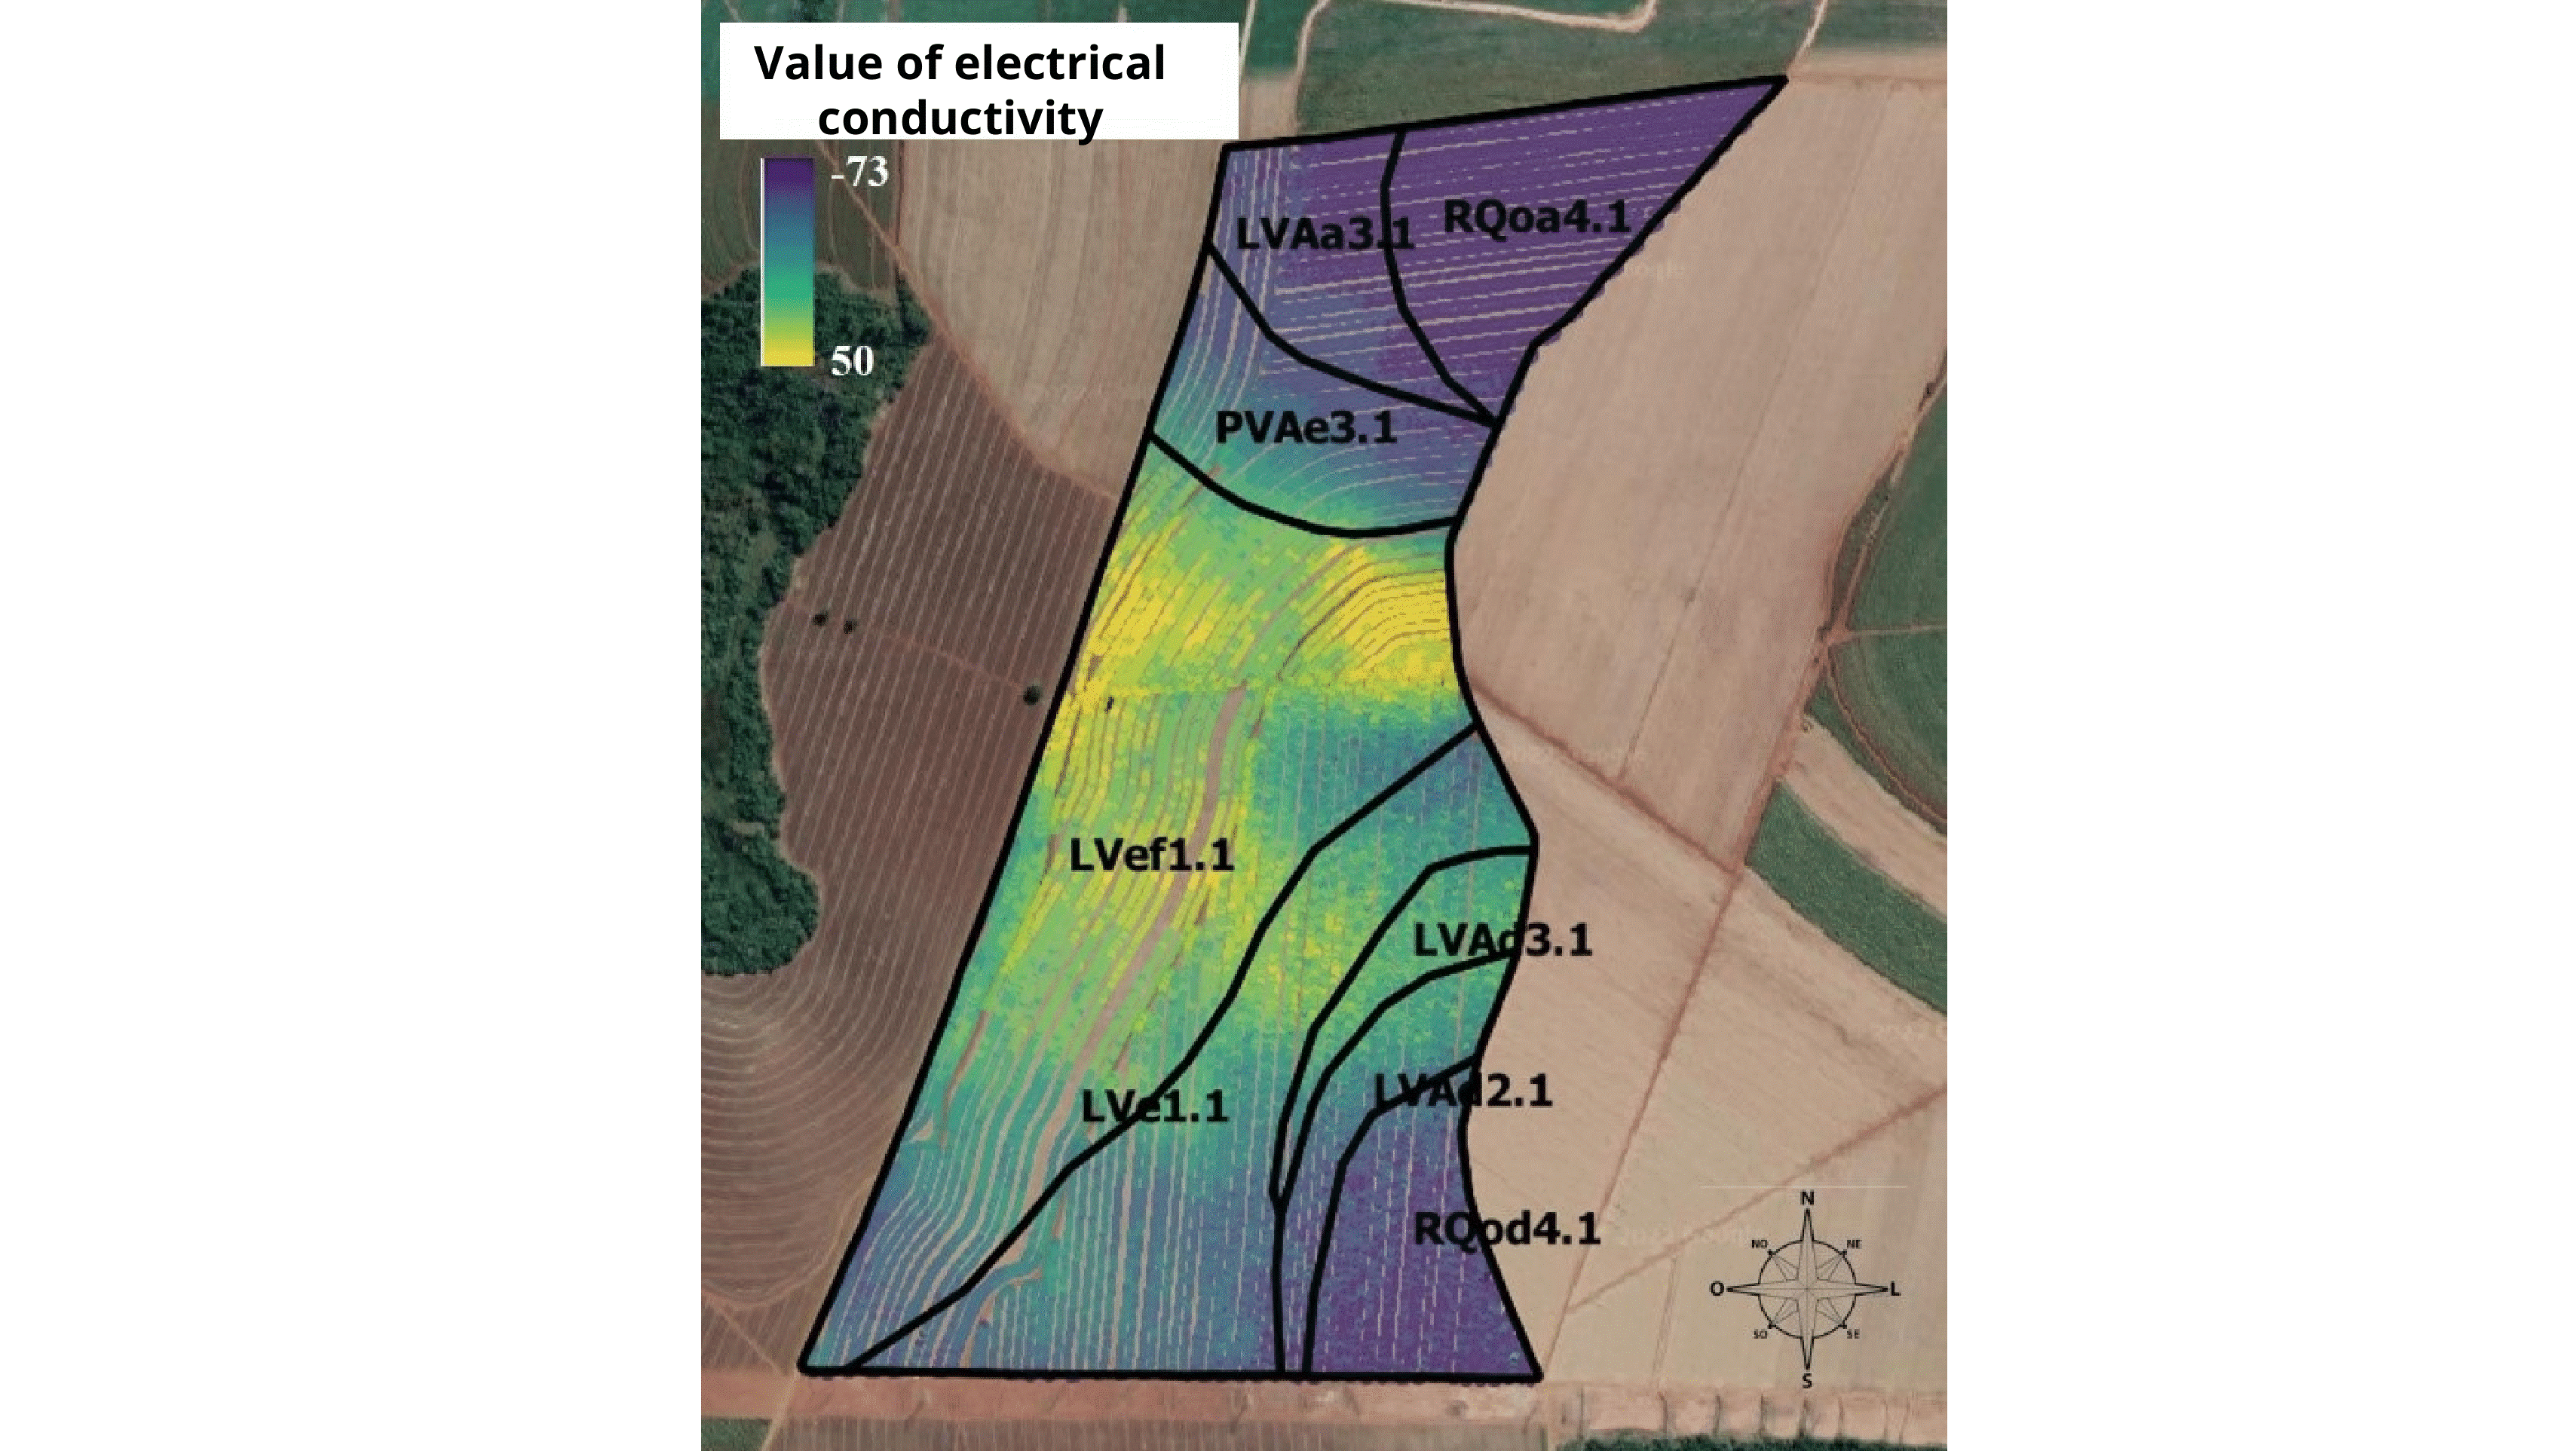
Figure 3 – Map showing the division of soil classes along an area of 110 ha and, in the background, soil apparent electrical conductivity data.
Another type of map is the “as-applied map”, which represents quality of the application performed, or what was actually applied in the field. When comparing the application map with the prescription map, it is possible to infer about the quality of the application, including being able to identify important operational failures.
Possibilities of information obtained in the format of maps are increasing. Sensing techniques have improved in recent years, with cloud data analysis platforms and increasingly robust tools. The possibilities have boosted by the “boom” of digital agriculture tools.
Increasingly, farmers and professionals needs to be able to work with these technologies, seeking to generate spatialized knowledge for a more efficient management, based on data.
READ MORE: